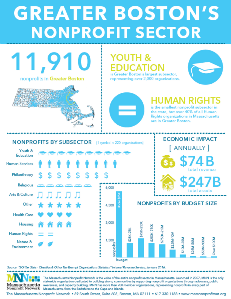
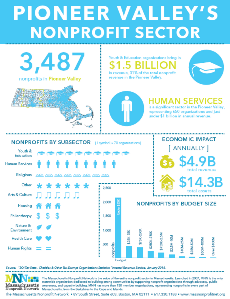
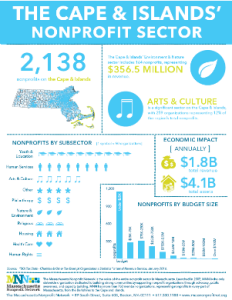
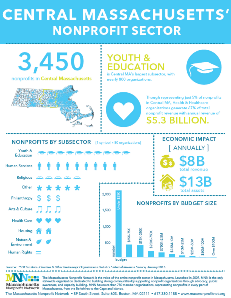
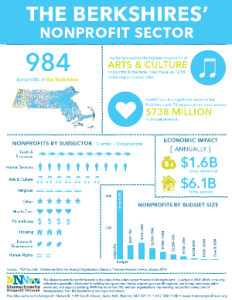
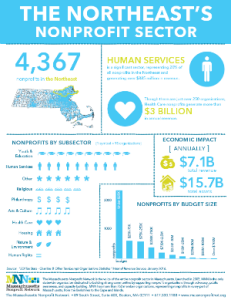
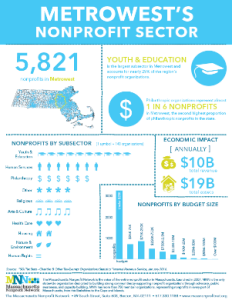
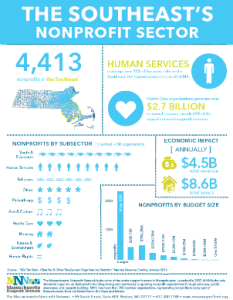
Nonprofits across the Commonwealth share a range of experiences, but there are a great deal of differences determined not only by an organization’s size and mission, but also by where an organization operates. Click on the infographics below to view numbers, stats, and facts about the nonprofit sector in your region:
More regions coming soon…